4 Nov 2026
Mapping Spatial Configurations and Their Influence on Card Game Dynamics in Gambling Facilities
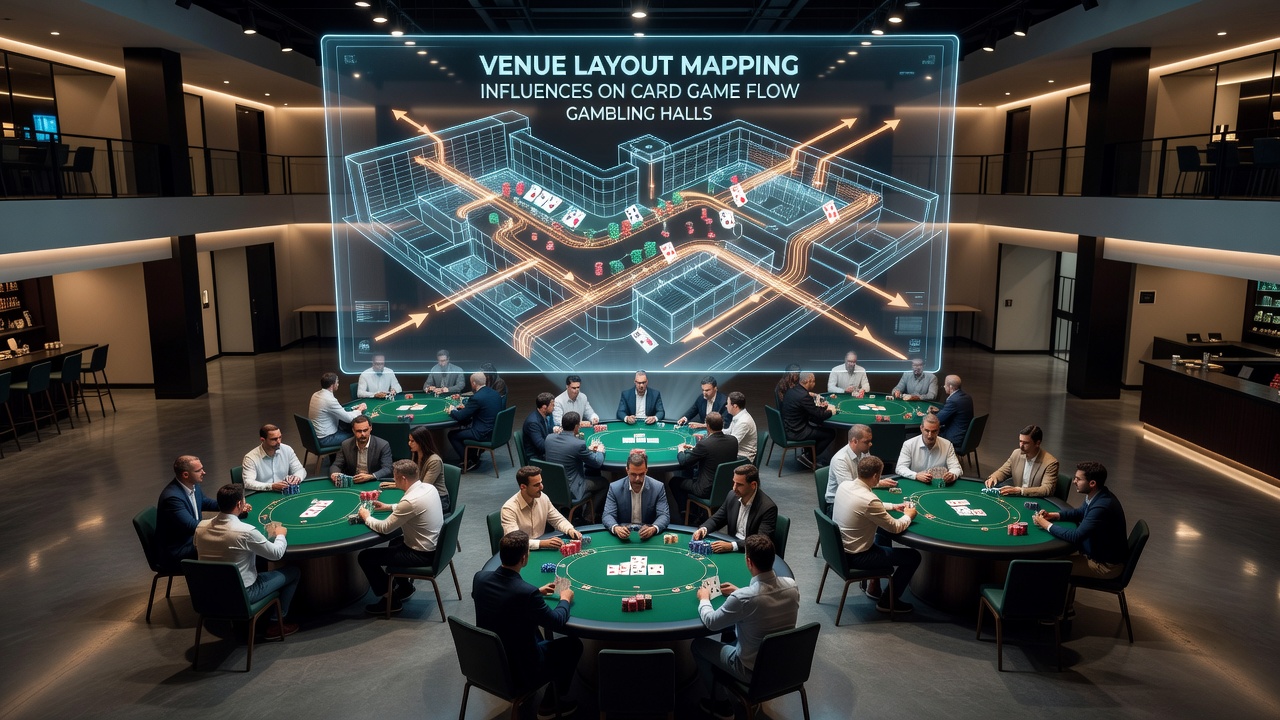
Venue layouts in gambling halls play a direct role in determining how card games progress from one hand to the next, and researchers continue to track these patterns across multiple jurisdictions. Data collected from operational reports show that table placement, aisle width, and proximity to high-traffic zones alter the time players spend at tables as well as the frequency of dealer changes. Observers note that when facilities position card tables in clusters separated by service corridors, game flow tends to slow because staff movement increases and players wait longer for chip fills or rule clarifications.
Core Elements of Venue Layout Mapping
Mapping exercises begin with digital floor plans that record exact distances between tables, entrance points, and cashier cages. Analysts overlay player movement data captured through loyalty card systems and security camera timestamps, which reveals average dwell times at each station. Studies conducted by the Nevada Gaming Control Board indicate that tables located within eight meters of main walkways experience 12 percent higher turnover rates than those positioned in recessed alcoves. These measurements allow operators to adjust spacing before new floor configurations take effect.
Lighting levels and sightlines also factor into the mapping process. When overhead fixtures create glare on card surfaces, dealers pause more often to confirm hand rankings, extending round duration by several seconds each time. Facilities that install adjustable LED arrays report smoother transitions between games because players maintain consistent visibility without requesting additional lighting adjustments from staff.
Traffic Patterns and Game Progression
Card game flow depends on how quickly empty seats fill after players cash out. Layouts that funnel foot traffic past table banks increase the chance that observers will join ongoing games, whereas dead-end sections reduce spontaneous participation. A 2024 report from the Canadian Gaming Association documented that venues with curved pathways leading directly to poker and blackjack areas recorded shorter average wait times for seat assignment compared with linear corridor designs.
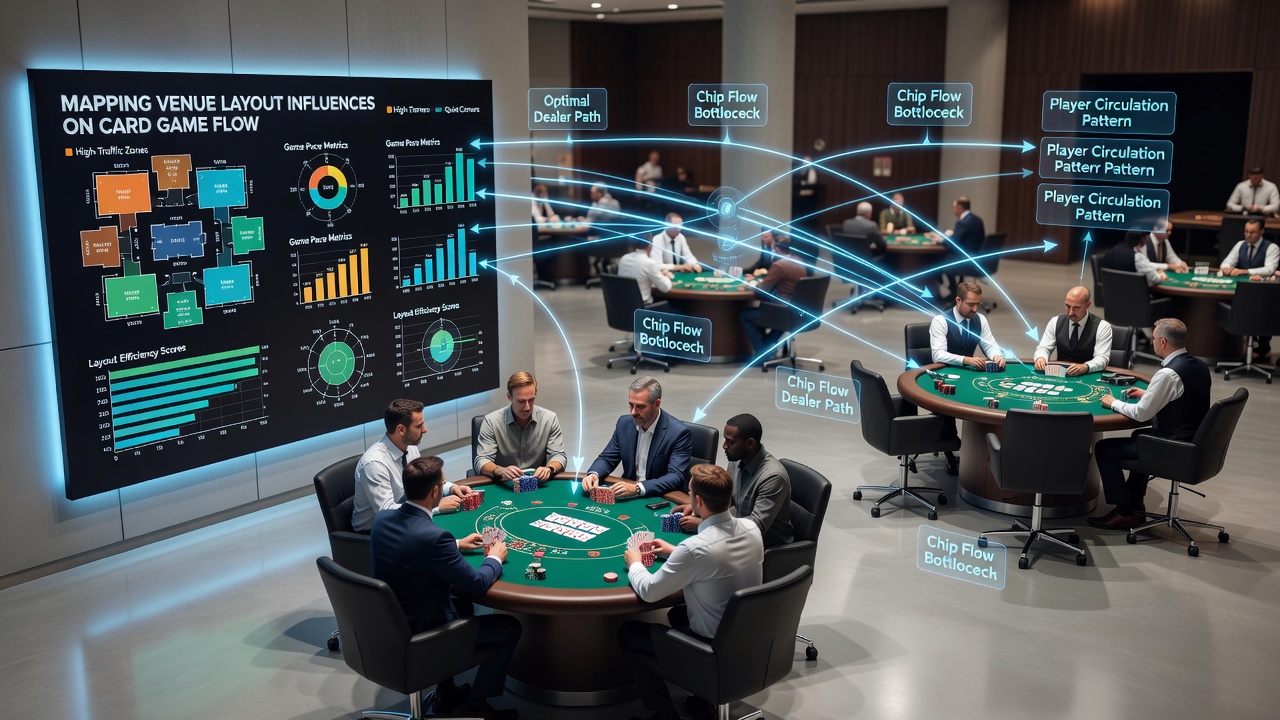
Service access points represent another variable. When chip runners and beverage carts share the same narrow aisles, congestion builds during peak evening hours. Mapping software highlights these choke points so management can reroute staff routes or widen passages during renovation cycles. One facility in Atlantic City implemented such changes in early 2025 and recorded a measurable decrease in average hand completion time across its card pit.
Regional Data and November 2026 Developments
Industry tracking continues into November 2026 as several operators prepare updated layout submissions for licensing reviews. Figures released by the Australian Gambling Research Centre show that facilities incorporating real-time occupancy sensors into their mapping systems achieved more consistent game pacing across different shift periods. These sensors feed data into central dashboards that flag when a section reaches capacity and prompt staff to open additional tables in underused zones.
European regulators have begun requiring similar spatial analysis as part of annual compliance filings. Operators in Malta and Gibraltar now submit annotated floor plans alongside revenue reports, allowing authorities to verify that layout changes do not create bottlenecks that could affect game integrity. The process involves cross-referencing camera footage with transaction logs to confirm that card game rounds maintain expected durations.
Technology Integration in Layout Analysis
Modern mapping relies on integrated software that combines architectural drawings with live operational metrics. Heat maps generated from player tracking systems highlight zones where card games experience frequent interruptions due to external noise or visual distractions. Facilities use this information to reposition tables away from stage areas or promotional displays that draw crowds during tournament events.
Acoustic modeling adds another layer. Sound absorption panels placed along walls near card pits can reduce ambient noise that otherwise forces dealers to repeat announcements, which lengthens each round. Research from university engineering departments has quantified these effects, showing that controlled acoustics correlate with steadier game rhythms throughout operating hours.
Conclusion
Mapping venue layouts provides gambling halls with measurable data on how spatial decisions shape card game flow. Continued collection of movement statistics, combined with input from regulatory bodies across North America, Europe, and Australia, supports ongoing refinements to table placement and circulation routes. As operators prepare documentation for November 2026 reviews, the focus remains on aligning physical arrangements with operational records to maintain consistent game progression.